Introduction
Artifact is a digital card game developed by Valve and released on November 28th, 2018. Despite the initial excitement of online gaming communities and internet personalities, the innovative mechanics and the depth of its strategic aspects, Artifact launch was a big flop. The player numbers started to dramatically drop following the game release, and Artifact reputation became controversial. As a consequence many streamers, youtubers and professional players decided not to commit time and resources in a game that was clearly not attracting enough interest. According to the most popular opininons, Artifact insuccess seems to be driven by a combination of factors:
- The lack of a proper ladder and rewards;
- The monetization system requires to pay to obtain cards and access the most competitive game modalities;
- The game price is 20$.
I tried to follow the development of these complaints and other opinions from their early formulations to the point they became inflated memes and shitposting actions on Reddit, Twitter and Twitch, realizing that the reasons behind the game insuccess might be more complex than “just” its price, monetization and reward system. Is it possible that people simply don’t like playing the game? Could it be that it is just boring or not engaging enough? And if so, what is actually wrong with the game? On this page you will find the outcome of a spontaneous and independent survey contucted on r/Artifact with the goal of exploring how players approach Artifact, how they feel when playing the game, how often they play it and what they like/dislike about it.
The Artifact player experience survey
The survey consisted of 5 sections: the first was to collect demographic information, such as how often people play the game and which game modality, to contextualize the subsequent game evaluation. The second, third and fourth sections included a total of 70 items adapted from the Game Experience Questionnaire - GEQ [1] and the MEEGA+ questionnaire [2], that have been previously used to evaluate gaming experience in various contexts. These consistituted the quantitative part of the game experience evaluation. Finally the last section aimed at collecting qualitative information, by asking participants to list 3 positive and negative aspects related to Artifact.
Artifact experience in 15 dimensions
The items of the quantitative sections were rated by participants on a scale from 1 (not at all) to 5 (extremely) and grouped into 15 dimensions, 11 were directly related to the immediate game experience:
- Immersion. The player interest in the game story/lore, the involvement with the game elements and the possibility of being creative and imaginative while playing.
- Flow. If you ever had the feeling of being so focused on something to the point that you lost the sense of time, then you were experiencing flow. This is an important aspect of the gaming experience as it is related with an intrinsic motivation to play.
- Positive Affect. How fun and exciting is the game.
- Satisfaction. Feeling you are progressing due to your effort is an essential aspect of gaming. This feature tries to capture how strong is the player sense of achievement.
- Competence. The sense of being skillful and succesfull in the game.
- Challenge. It’s related to the game difficulty, the time pressure and the effort required to play.
- Annoyance. A high score in this dimension indicates that a great sense of tension, frustration and nervousness characterised the gaming experience.
- Negative Affect. The bad feelings of the player such as boredom, bad mood and low engagement.
- Learnabity. Measures how easily one can start playing the game from scratch, how clear are the rules and the game mechanics.
- Aesthetics. The exterior game’s appearence: the graphics, the sound quality as well as the design of cards, boards, and interfaces.
- Social. Does the game promote cooperation or interaction between players?
The remaining 4 dimensions were measuring game experience after-effects:
- Negative Experience. If you felt that playing the game was a waste of time, you felt bad and ashamed about it.
- Positive Experience. How good was the overall gaming experience? A high score suggests that the game left you with feelings of satisfaction and accomplishment.
- Tiredness. The sense of exhaustion that can be experienced at the end of the play.
- Return to Reality. How strongly you were thinking about the game afterwards and how hard it was to come back to reality.
A closer look at the participants sample
The global sample of the respondents consisted of 105 players. Among these, 3 didn’t complete all the sections of the survey and 4 explicitly claimed they never played Artifact. These respondents were excluded from the analysis, leading to a sample of 98 participants (2 female, mean age = 27.9 ± 6.5).
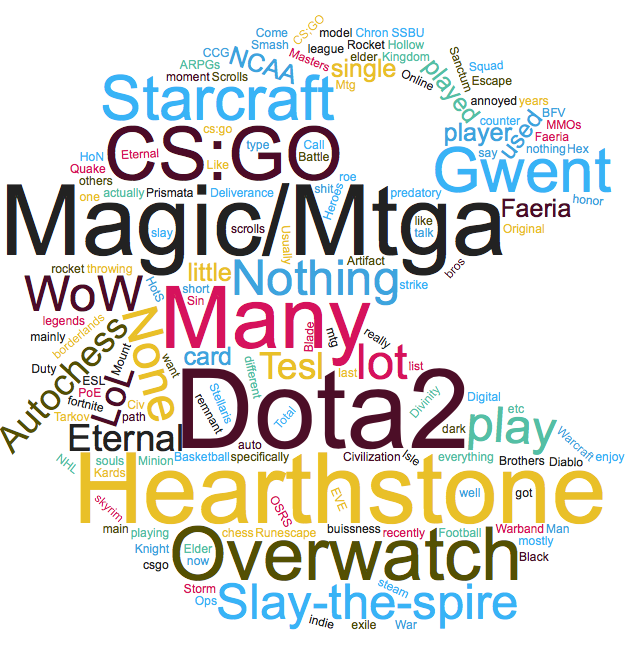
The first thing we want to check is our players gaming background. Not surprisingly the majority of respondents mentioned Dota2, Hearthstone and Mtg/Mtga as games they regularly play. These are indeed the popular games more closely related to Artifact in terms of lore, gametype or developers. Alltogether 65% of the sample plays card games and quite interestingly, nearly 25% mentioned the two FPS which follow the top 3 on the chart: Overwatch and CS:GO.
| Game: | Dota2 | Hearthstone | Magic/Mtga | Overwatch | CS:GO | Gwent | Starcraft | WoW | Slay the Spire | LoL | Eternal | TESL | Autochess | Faeria |
|---|---|---|---|---|---|---|---|---|---|---|---|---|---|---|
| % of players: | 39.3 | 26.6 | 19.1 | 13.8 | 9.5 | 8.5 | 7.4 | 4.2 | 4.2 | 3.1 | 3.1 | 3.1 | 3.1 | 2.1 |
As one of the current issue of Artifact seems to be the low concurrent players number, let’s have a look at how often our participants actually play the game compared to other games.
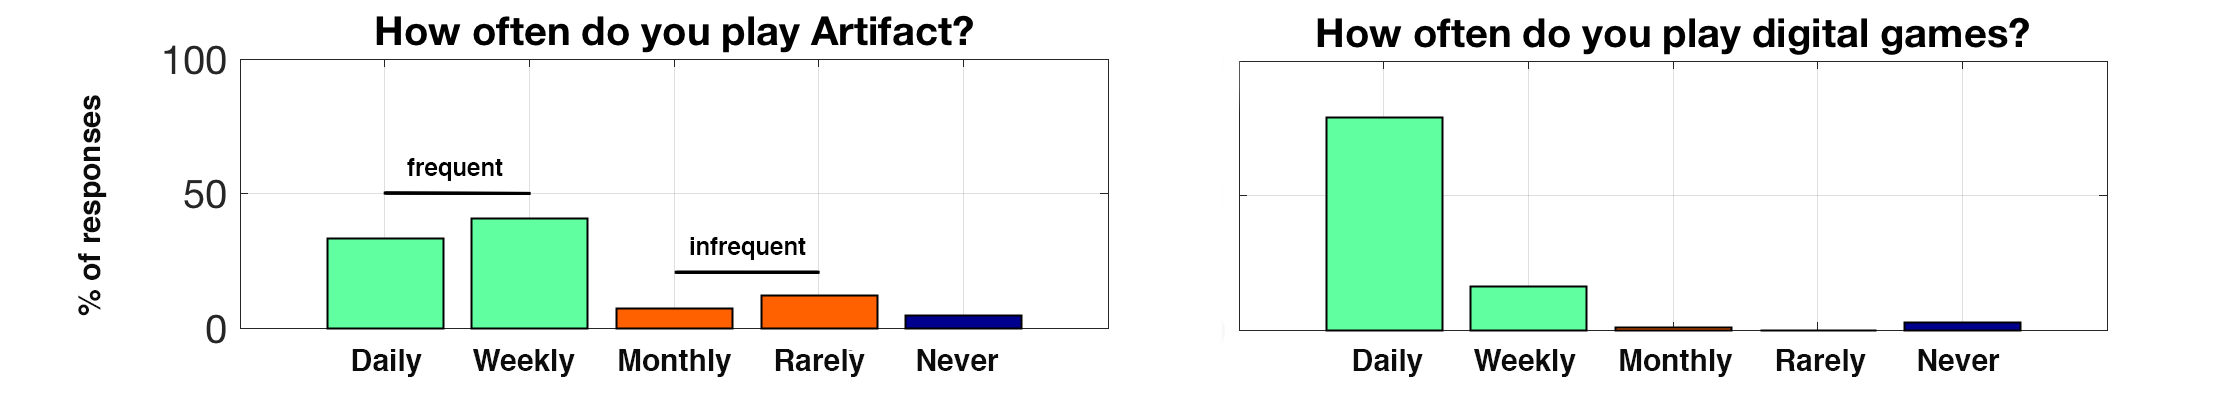
The pattern of play-frequency appears quite different for Artifact vs other games. More than 95% of the sample frequently (daily or weekly) plays digital games whereas only 75% frequently plays Artifact. Before examining the potential differences between these two subgroups, I want to first show the most played Artifact game modalities by pooling data from the global sample.
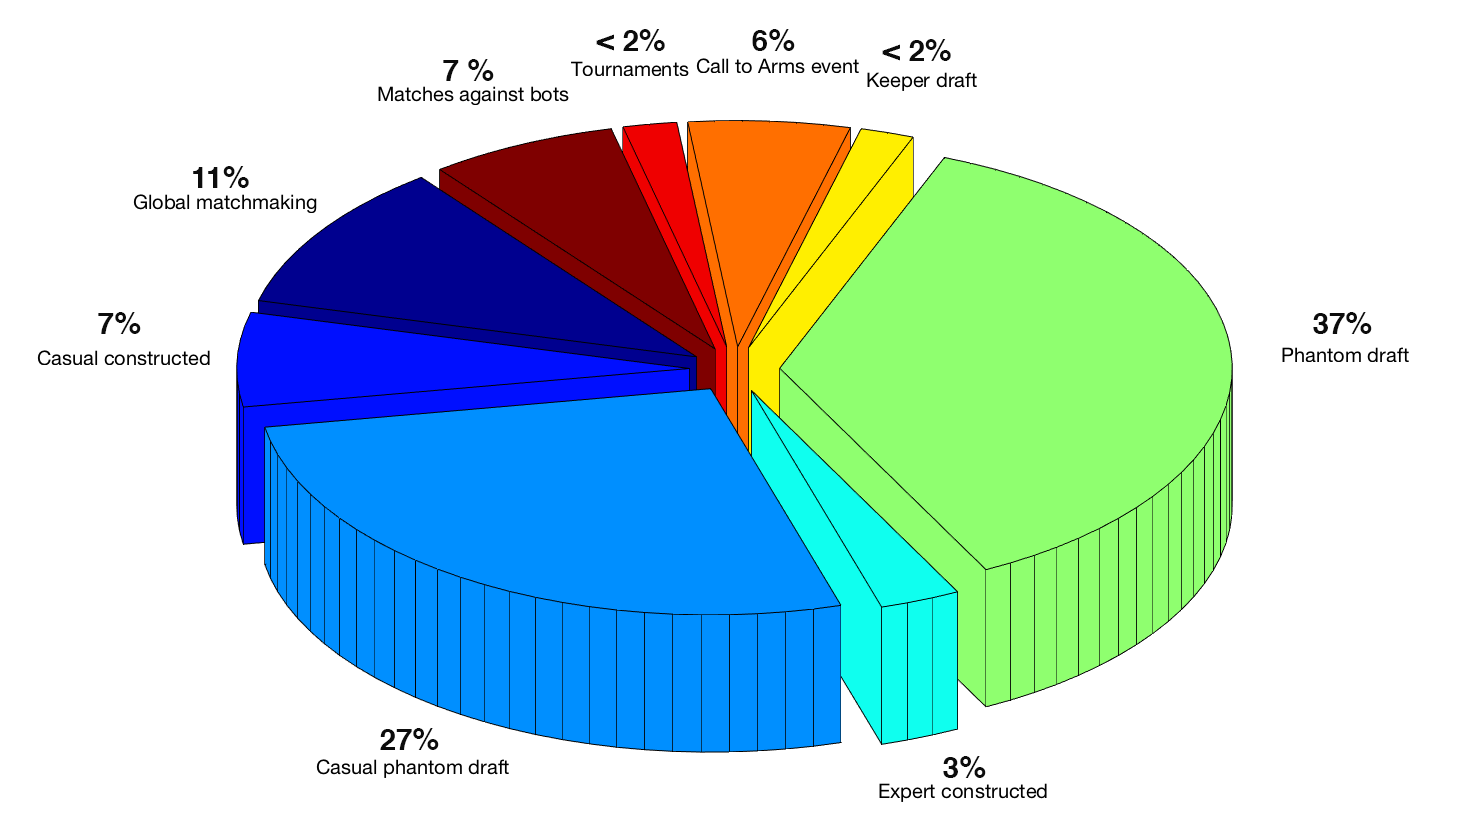
Respondents where asked to indicate their most played Artifact game modality. They were allowed to indicate only one preference. I decided to group together the categories Draft tournaments and Constructed tournaments because of the low amount of responses. The chart shows that the most played game modalities are expert phantom draft and casual draft, accounting for around 64% of the sample. Only a minority of people seems to be mainly active in constructed: around 21% of the participants considering all of the constructed formats.
Two types of Artifact player
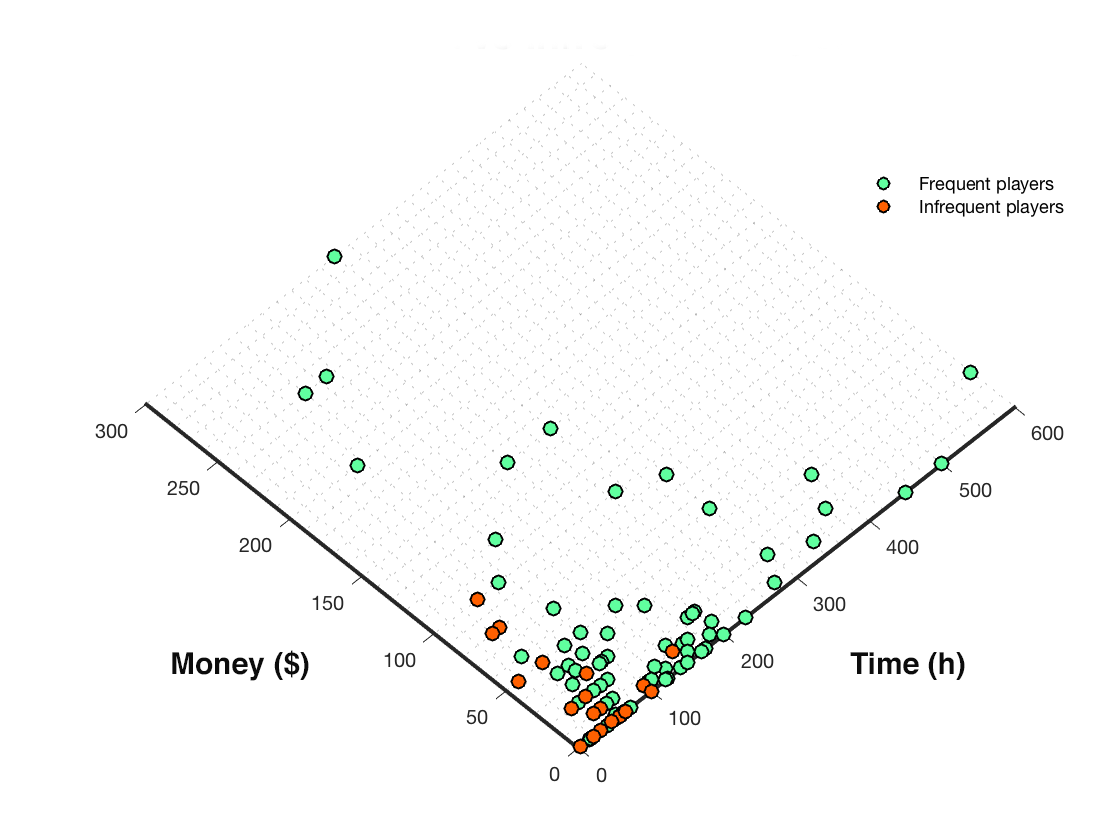 It’s worth noting that the sample of participants could be split into at least two groups: the frequent and the infrequent players. This rough subdivision is interesting because it might capture the differences between players that are fully engaged and those that are not very engaged with the game.
However, because of the small sample size and the unbalance between the groups (77 frequent and 21 infrequent), I decided not to run statistical tests to compare the two groups as it would not be very meaningful.
| Group: | Frequent players | Infrequent players |
|---|---|---|
| Sample size: | 77 | 21 |
| Mean amount of hours: | 113.8 | 52.5 |
| Mean amount of money ($): | 62.7 | 31.2 |
Instead what I am going to show you in the following sections is the “ranking” of the features evaluated by the two subgroups. In this way it might be possible to have a general idea of the differences charachterizing the gaming experience of the two subgroups (without drawing any conclusion on the general population).
Artifact experience evaluation
Participants rated the game experience on a scale from 1 (not at all) to 5 (extremely), the items of the core questionnaire were then grouped into 11 dimensions and the items of the post gaming questionnaire into 4. The mean ratings are shown here for the two subgroups and sorted in descendent order from top to bottom. The colors associated to each feature is the same in both charts to capture differences between the groups at a glance.
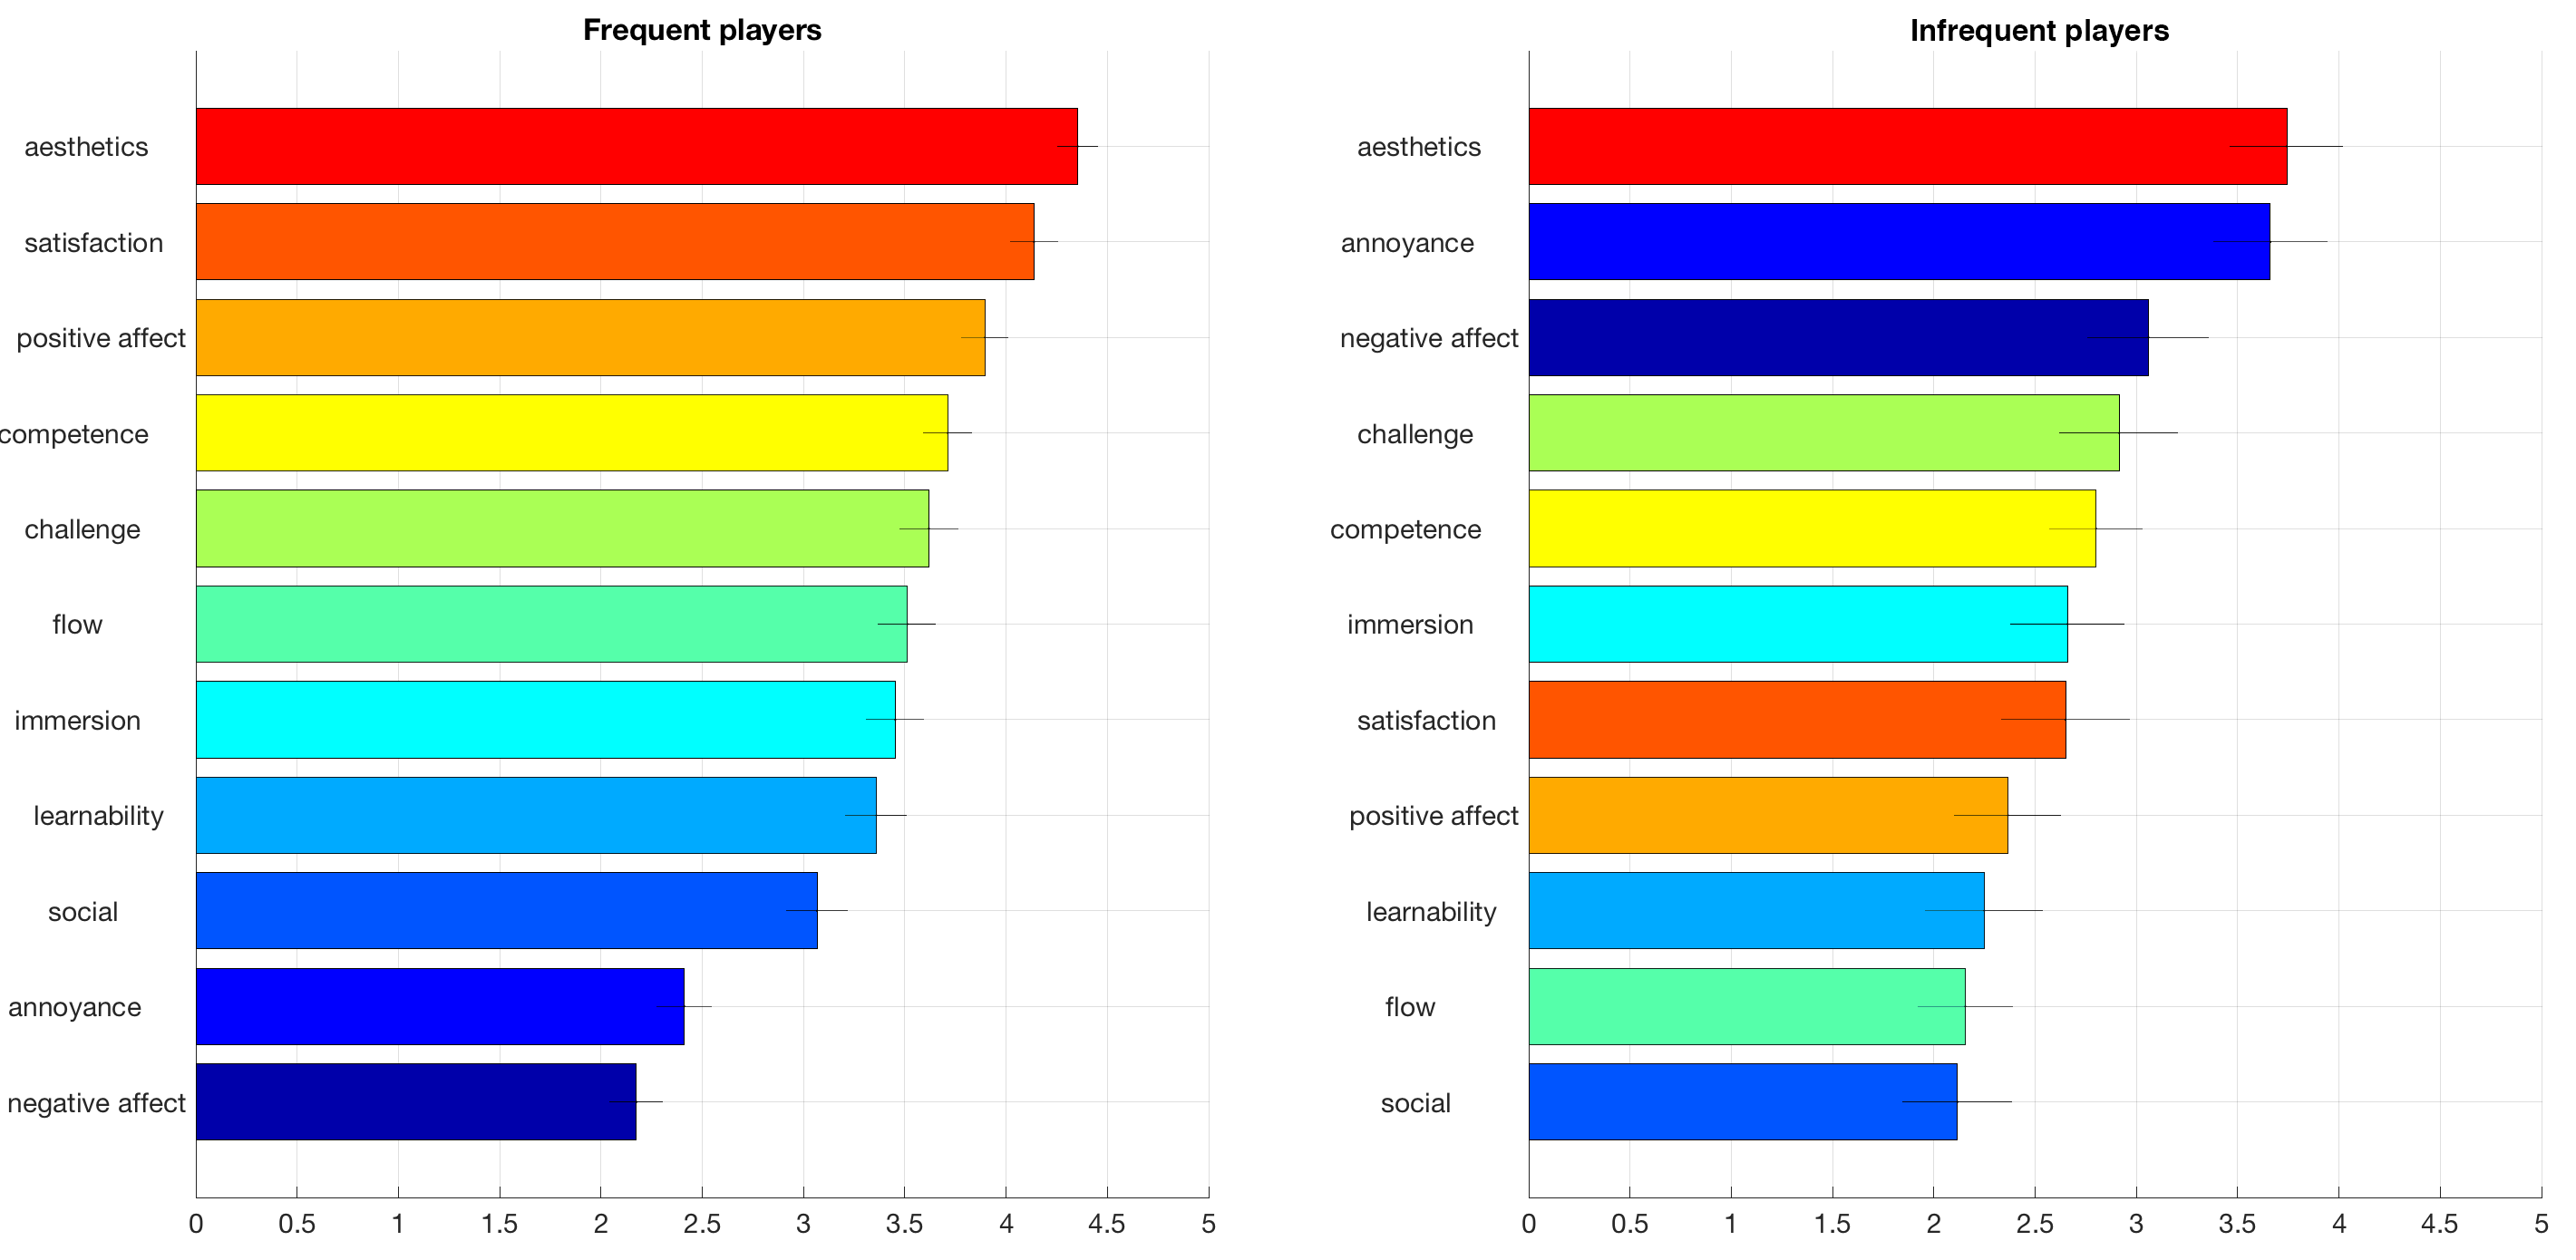
There are some similarities and some striking differences in the ratings of the two groups. Starting from the top of the charts, aesthetics is the highest rated feature in both groups (4.3 frequent players and 3.7 infrequent players). All of the players consider the game exterior appearence, the sound, the cards and boards design to be beautiful. This is pretty much the only dimension in which the two group ratings are in strong agreement.
As we look at the other two positions of the top 3, things start to diverge dramatically. The prevalent features for frequent players are satisfaction (4.1) and positive affect (3.8). For this group the sense of achievement coming from a victory, the feeling of progression due to personal effort and the fun of the game are prevalent aspects of the Artifact experience. They would totally recommend the game to a friend or a colleague. Quite the contrary for the group of infrequent players: they experience high levels of annoyance (3.6) and negative affect (3). This means that they feel tense and frustrated while playing the game. For them Artifact is not engaging and they are easily distracted or bored during a match.
The 4th and 5th positions of the charts are occupied by competence and challenge, with competence being more dominant for the frequent players and challenge for the infrequent players. Competence is the sense of being skillful at the game whereas challenge is a measure for the game difficulty.
It is worth mentioning that for both groups, Artifact learnability is relatively low, which means that the game rules are perceived as complex and not easy to grasp from the tutorial. Also worth noting that the social aspects of the game is located at the bottom three of the ranks for both groups. The game is not considered to be interactive, cooperation and competition are perceived as not incentivized.
Finally, while frequent players experience an average flow of around 3.5, for infrequent players this is one of the worst rated features (2.1). The sense of flow is the experience of deep concentration, dedication and engagement, typical of someone enjoying a certain activity. It is related with an intrinsic motivation to perform that activity, which makes it inherently rewarding.
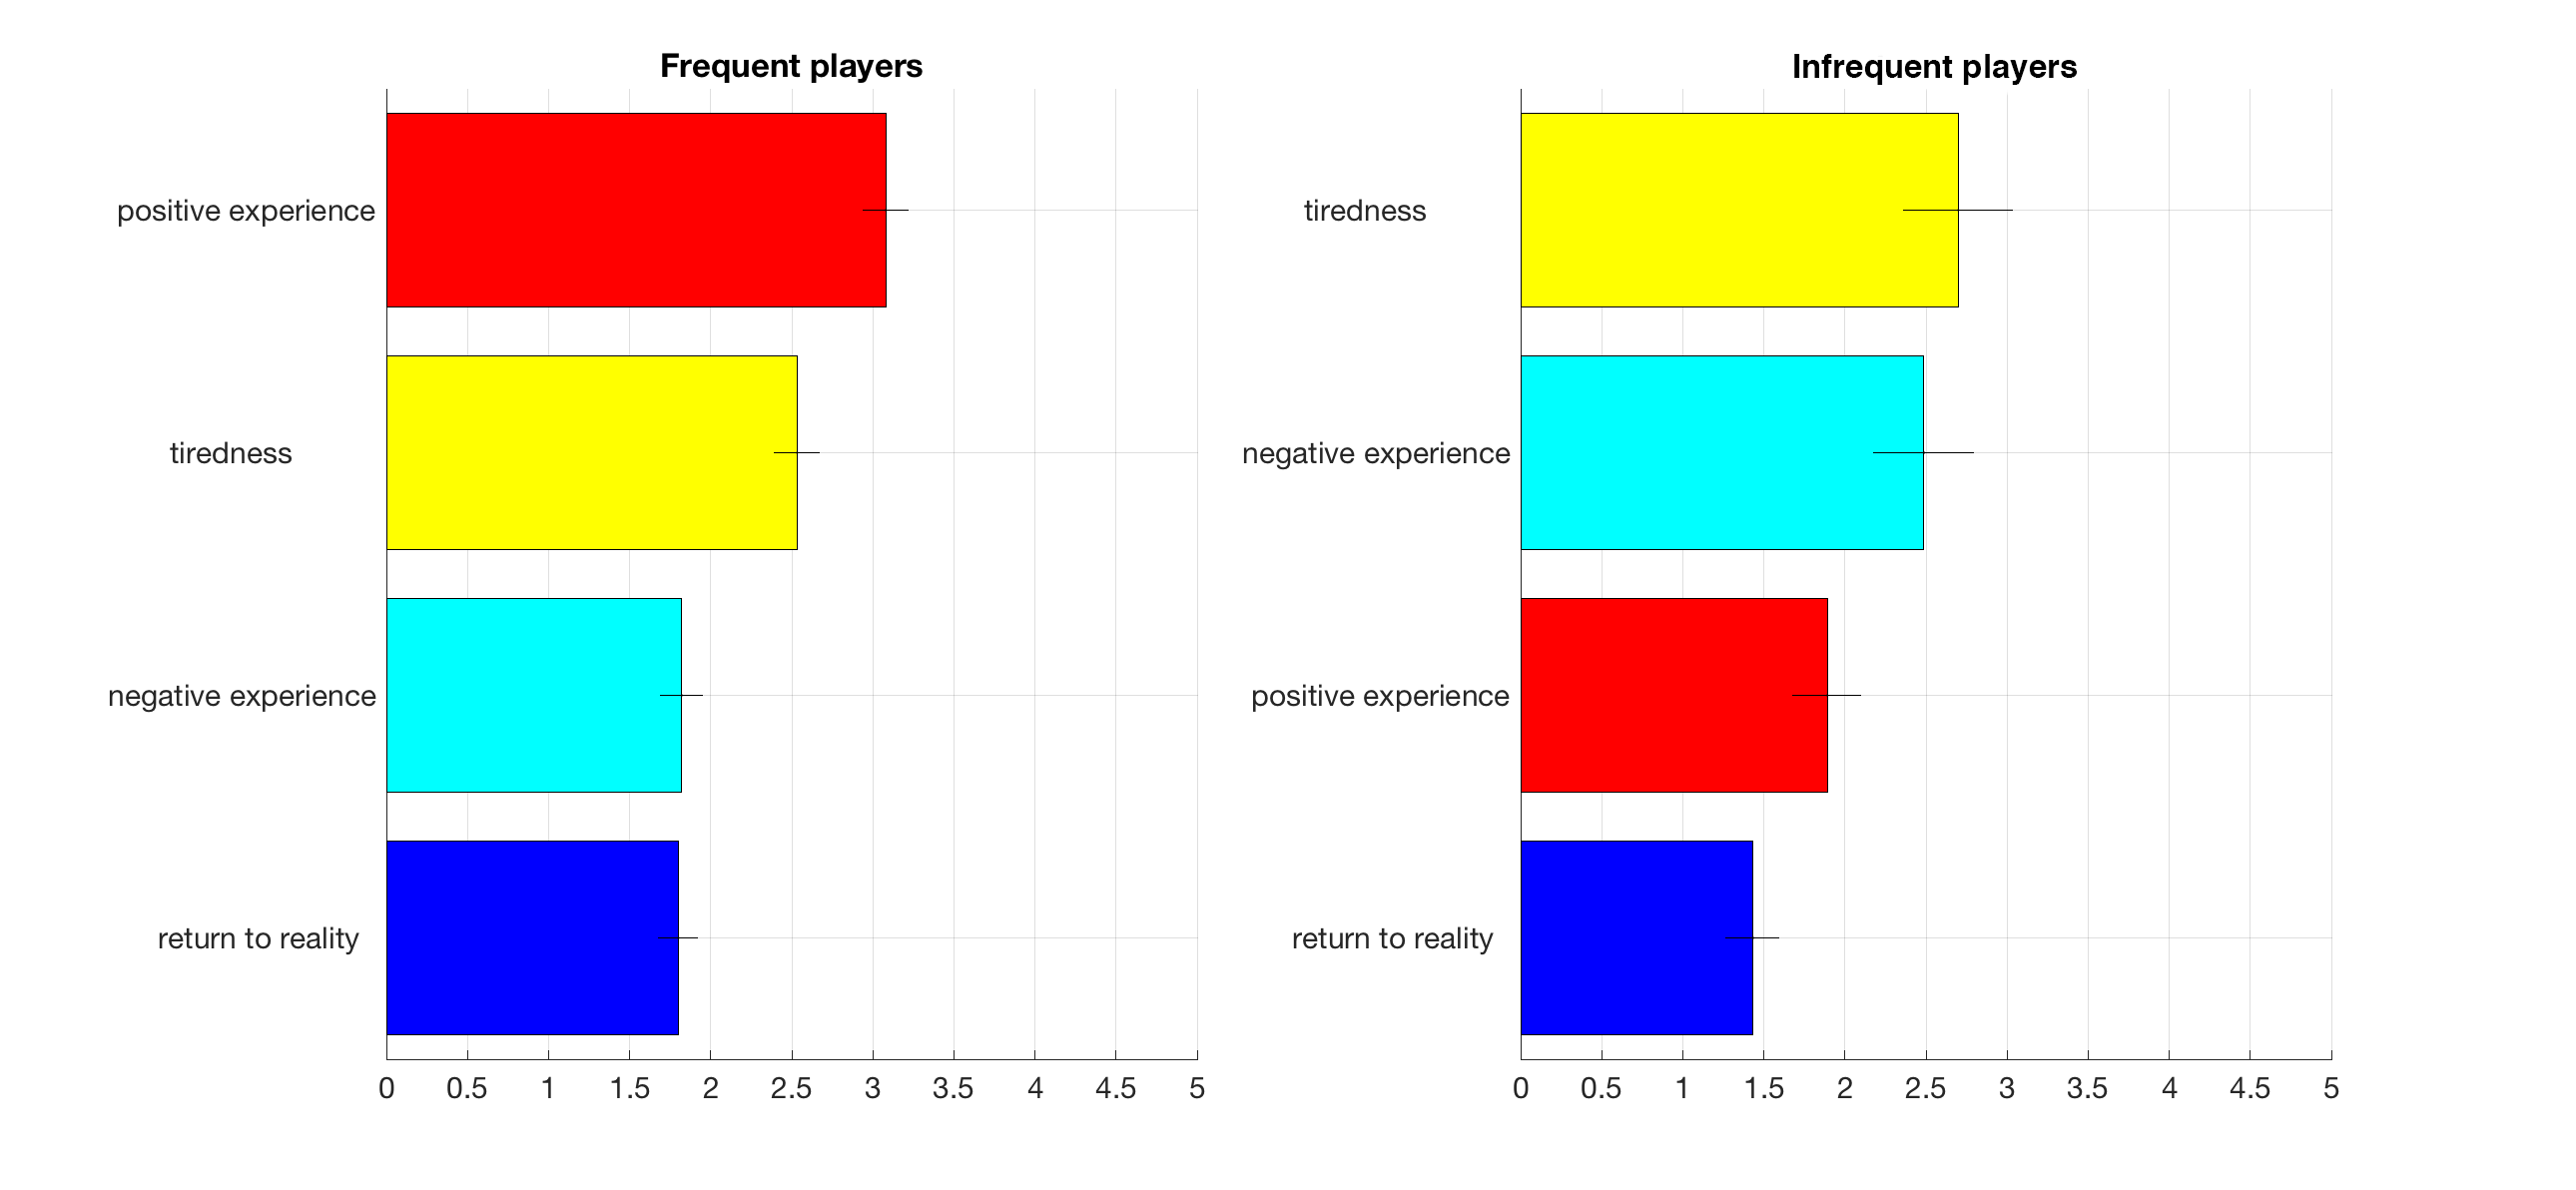
The ratings are somewhat consistent for the section related to the Artifact experience after-effects.
For the frequent players positive experience is the dominant feature (3.0), followed by tiredness (2.5) and negative experience (1.8). For infrequent players instead is tiredness being at the top of the chart (2.7) followed by negative experience (2.4) and positive experience (1.8). Both groups experience low levels of return to reality, which means that they don’t think too much about the game after they stop playing, and don’t feel disconnected with reality.
Exploring the relationships between pattern of features
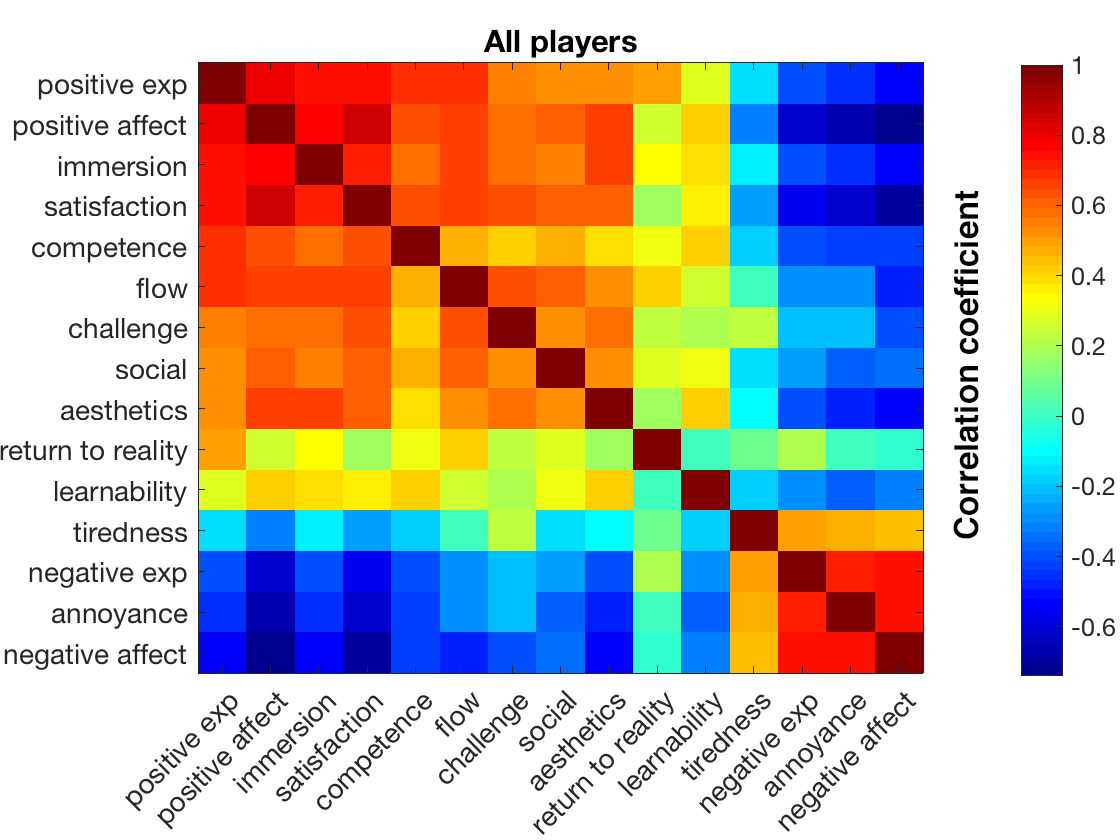
The previous section shows the ranking of the feature ratings made by the two subgroups of participants. This comparison is interesting by itself, as it shows the dominant elements charachterising players experiences. However it doesn’t clarify what is important in defining the players positive or negative experience in the two groups. One approach to address this issue could be to run a regression analysis and observe which of the features better predicts the rating in “positive experience” in the two groups. However, because the dimensions of the questionnaire are inherently correlated with each other, the importance of each feature in explaining “positive experience” would be hard to interpret.
I might try to develop develop a shorter version of the questionnaire with less items in the future, to specifically address this issue.
Positive and negative aspects
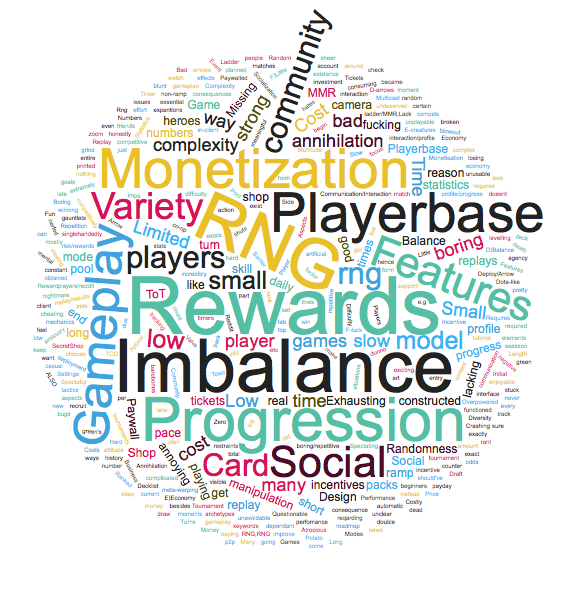
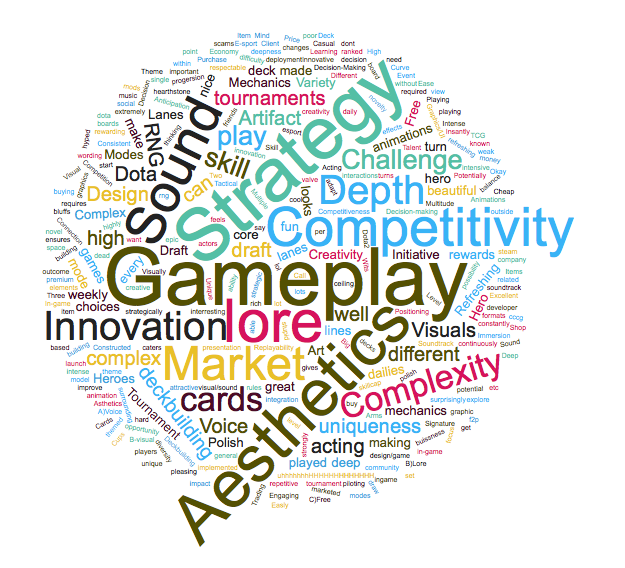
Wordclouds of the most common negative (left) and positive (right) aspects of Artifact. Data collected from the survey's qualitative section
Finally coming to the last section of the survey, I asked participants to list 3 positive and negative aspects about Artifact. Participants listed a very colorful variety of praises and complaints. In order to make sense out of them and compare the opinions of our two groups of players, I decided to classify them in categories. Below you find a couple of quotations directly taken from the outcome of this section:
(A) Artifact has a lot of depth in its gameplay. This ensures a high skill ceiling and gives me opportunity to continuously improve. (B) Artifact caters to both rich and poor players as it has both well implemented Constructed and Draft formats. (C) Artifact feels premium. It has great UI, Soundtrack and Voice Acting.
D) automatic camera zoom after every fucking action; E) certain unavoidable blowout situations e.g. turn 1 track->payday->horn or turn 2 double ramp into ToT; F) annihilation. the card singlehandedly shuts down so many lines of play and even entire deck archetypes, it’s fucking broken and meta-warping and a total nightmare to gameplan around, and on top of that i’m pretty sure ramp and emissary and ToT only exist in their current form because annihilation exists to “keep them in check.” that card and the consequences of its sheer existence make constructed like 90% less enjoyable than it could be. btw old cheating death was ALSO a consequence of annihilation (it functioned as green’s annihilation counter) and the moment it got nerfed all non-ramp aspects of green became unplayable in constructed. that’s how strong annihilation is. honestly it should’ve never been printed. /end rant
I want to make some explicit remarks on how I categorized the text, as this was somehow arbitrary. After eyeballing the raw data, I decided to create categories of statements to group most of the opinions (Gameplay, Strategy, Aesthetics and so on). I then generated filters to target specific patterns of words or word combinations. Finally I searched in the text of each participant’s opinion for those word patterns that could be connected with the main categories. Every time the filter would recognize a participant opinion as falling in one of the categories, that would result in a +1 participant count for that category. Even if I tried to be general, I might have obfuscated some of the more precise judgements or generated some biases in the charts. Below you find some examples of the expressions I tried to match during the categorization.
Positive aspects
- Gameplay: cards, heroes, lanes, mechanics, gameplay, initiative.
- Strategy: strategy, decisions, abilities, skills, complexity, and depth.
- Aesthetics: graphics,visuals, aesthetics, polish, art, beauty.
- Lore: dota, lore, story, theme.
- Competitivity: challenge, competitive, tournaments, e-sports.
- Sound effects: sound effects, voices, actors.
- Market: cheap, free, trading, tgc, market, buy, price.
- Innovation: innovative, new, creativity, variety.
Negative aspects
- Gameplay: boring, complex, long.
- Monetization: money, buiness, cost, tickets, pay.
- RNG: rng, random.
- Progression: progression, ladder.
- Rewards: rewards, incentives.
- Features: bugs, crash, replay, stats.
- (Im)Balance: balance, cards, overpowered.
- Variety: diversity, variety.
- Playerbase: players, playerbase.
- Social: social, community, tournaments.
Charts
Here you find the charts with the ranking of the positive and negative Artifact opinions for frequent and infrequent players. The chart Y axis represents the percentage of players (within the group) that expressed an opinion falling in a specific category.
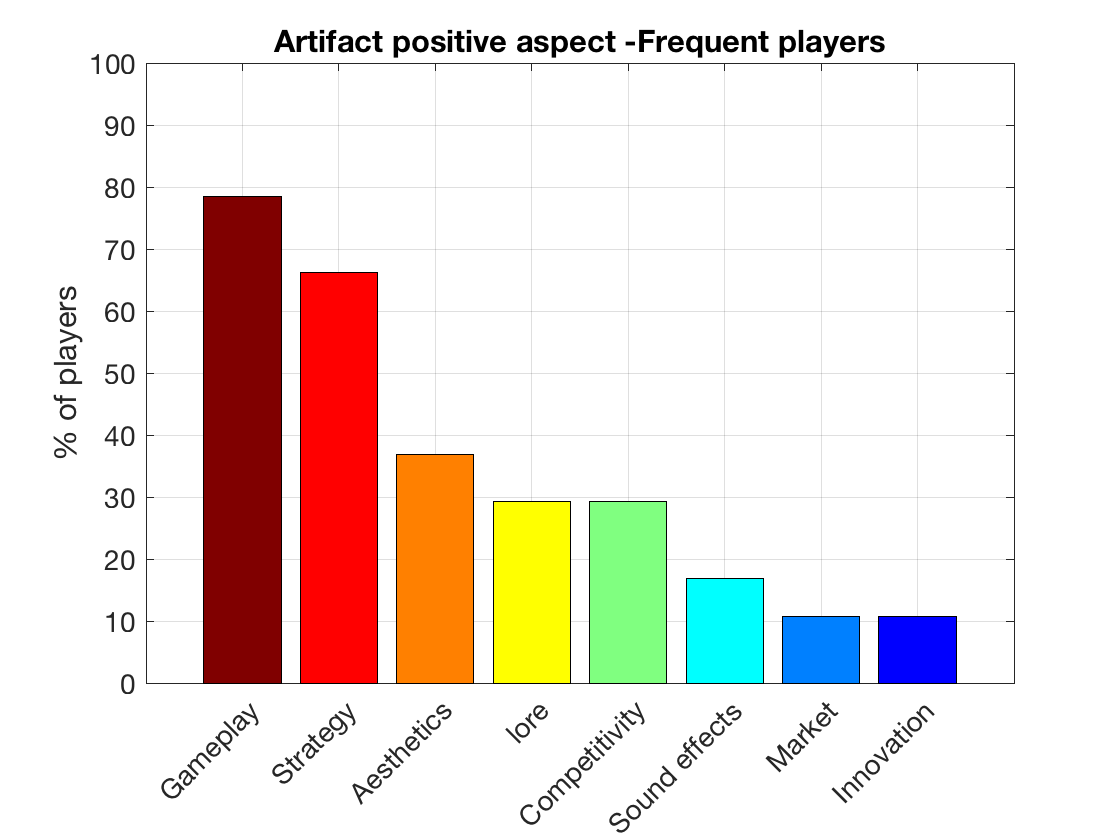
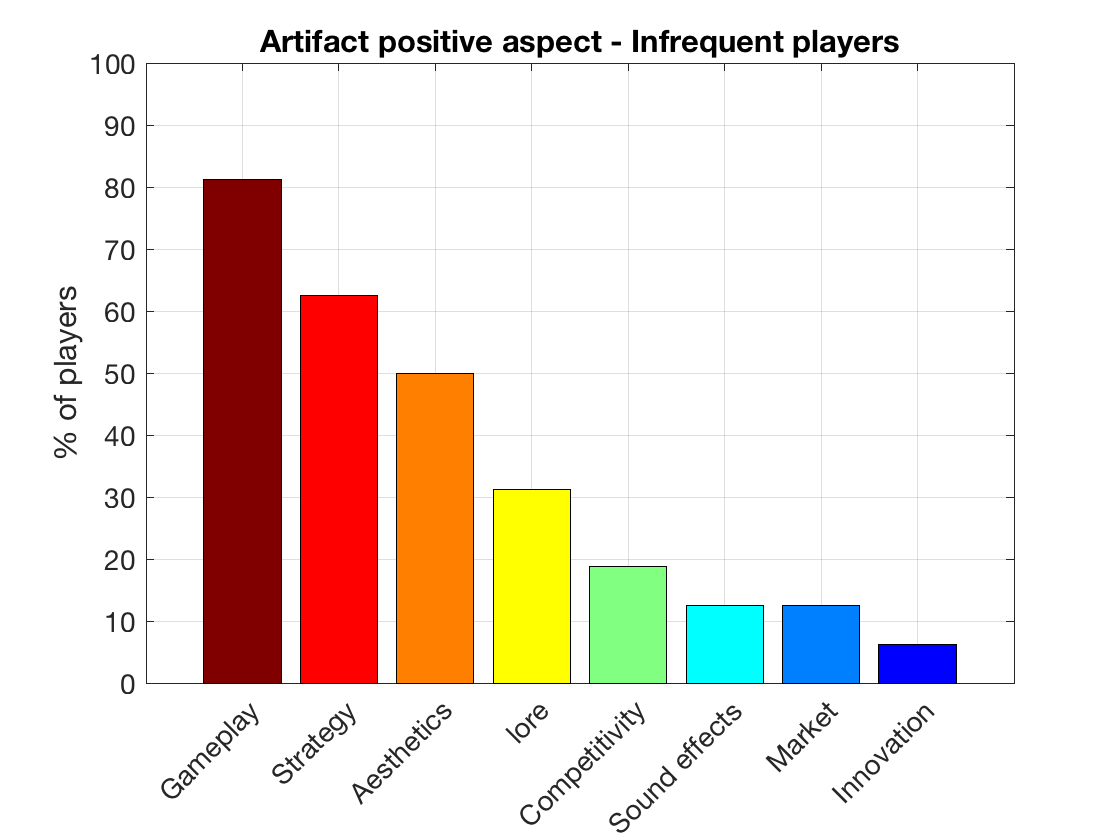
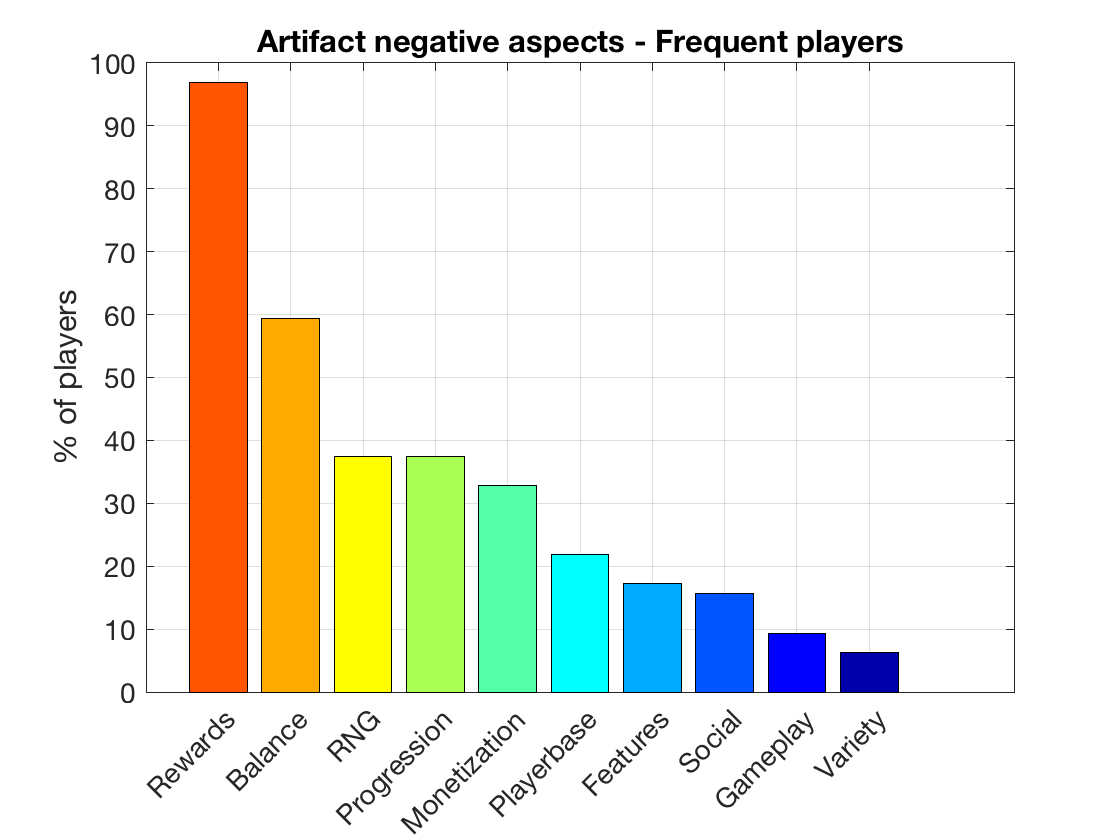
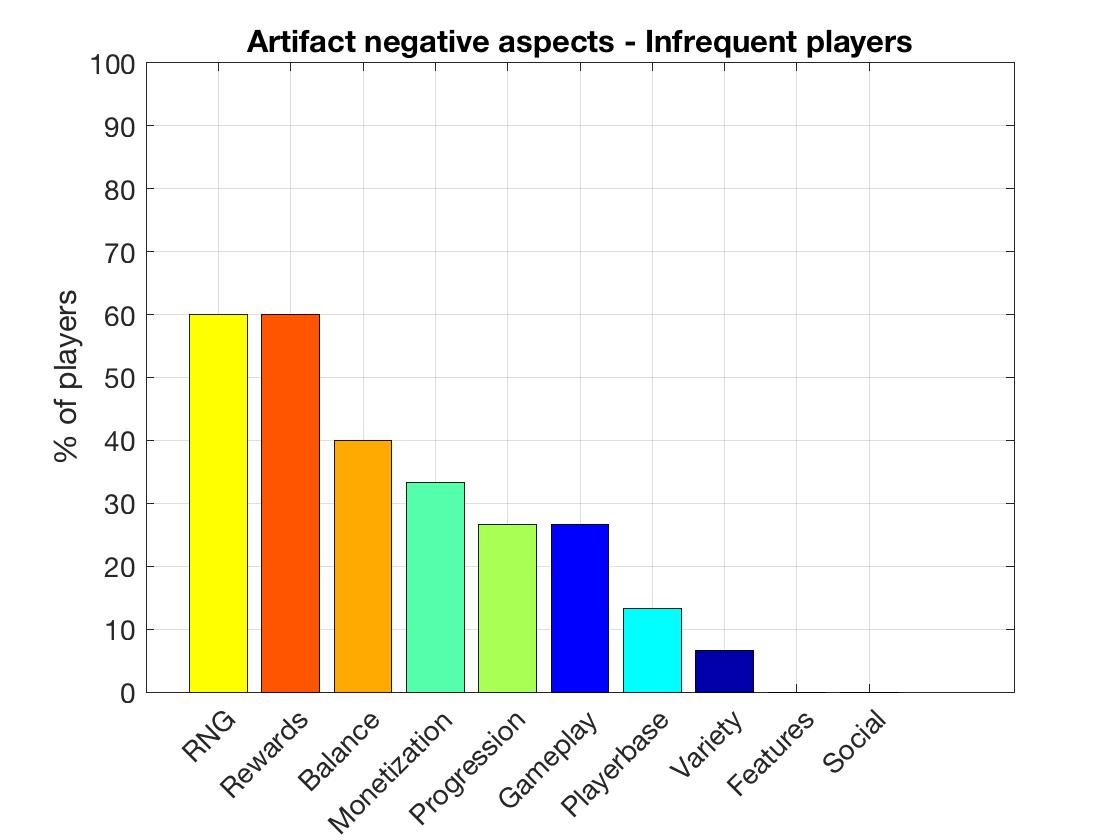
There is an incredible consistency in the pattern of positive aspects listed by both groups of players. Gameplay, strategy and aesthetics are at the top 3, followed by the lore, competitivity, sound effects, market and innovation. Also regarding the negative aspects of the game, there seems to be a general agreement between frequent and infrequent players. Rewards, RNG and card balance appear in the top 3 for both groups, with infrequent players stressing more on the randomness of the game and frequent players highlignting the lack of rewards. Even if mentioned by many players in both groups, monetization surprisingly fails to reach the top 3. In line with the previous game experience evaluation, we find more complaints regarding the gameplay from the infrequent player side, whereas missing features (such as game replays and after-match stats) are exclusively mentioned by frequent players together with the social aspects of the game.
Concluding remarks
I started this project with the intention to better understand what are the reasons behind Artifact insuccess. I was not fully satisfied with the common explanations circulating on online gaming communities, including the monetization, lack of rewards and the 20$ paywall. I decided to address the issue by running a survey. This was specifically targeting players with at least 6h of Artifact playtime in order to examine how they approach the game, how they feel when playing it, and what they like and dislike about it.
Despite the relatively low sample size, I think this data offers the possibility to draw some interesting conclusions regarding what is currently wrong with Artifact:
- Casual players. Some people are playing the game casually, and the game is not fun for them. It is tricky to actually determine from the current data whether they don’t play often because they don’t like the game or the other way around. However, for a considerable amount of Artifact players (roughly 20% of the survey sample), the prevalent feelings are tension, frustration and bad mood. They are not engaged with the game, have no clue on how to improve and have a hard time in mastering the game mechanichs.
- Learning the basics and social aspects. New players are struggling to learn the basics and in reaching out the gaming community as well. In fact, from the global rating, learnability and social aspects are among the worst of the Artifact experience. Even if the game is designed to be “hardcore”, new players always face an entry phase in which the game needs to be learned, the skills still need to be shaped and the community needs to be reached. It’s going to be quite hard for these people to fully enjoy the game’s best aspects from the beginning.
- Game modalities. Some of the game modalities are played by a ridiculusly low amount of players. Even if the sample of the current survey is relatively small, almost noone seems to play Keeper draft and even the constructed format (arguably one of the game main format) seems to be relatively under-represented in the current sample of players.
- Game balance and RNG. Many players, especially the frequent ones, are concerned with the game balance. They seem to be particularly unhappy with some cards perceived as too powerful. Moreover around 60% of the infrequent players and 37% of the frequent players agree on the fact that the game has too much RNG. I have the feeling that the RNG aspects of the game are not well understood by everybody. Facing some tilting situations while playing Artifact is inevitable, however I think that many would agree that RNG represents a crucial feature of the entire game mechanics, and (maybe?) also what makes the game so challenging. Sometimes getting lucky is a matter of skill.
- Rewards and progression. Needless to spend more words about these two features of Artifact. I know, you know, Valve knows, everybody knows. Some important changes in this direction need to be done in order to make the game more engaging, to attract new players and incentivize the development of the current playerbase.
Future directions
During the development of this project I had a bunch of new ideas on how to collect new data and make better use of the current ones. First of all there might be more information in the current dataset (for example comparing different groups of players). If some of you is interested in accessing the data I am happy to share them on this page. The only reason why I didn’t do this yet is because it will obviously require some effort and I am not sure if anybody would actually be interested (I might end up doing it anyways in the next couple of weeks). Second, I’m willing to develop a new survey in the near future: with less items and hopefully more participants. In this way it might be possible to test some real hypotheses and run more interesting analyses.
In the meantime, for any question feel free to contact me at ages914@gmail.com.
See you ingame bois, we are in for the long haul!
References
[1] IJsselsteijn, W. A., de Kort, Y. A. W., & Poels, K. (2013). The Game Experience Questionnaire. Eindhoven: Technische Universiteit Eindhoven.
[2] Petri, G., Gresse von Wangenheim, C., Borgatto, A.F. (2018) MEEGA+, Systematic Model to Evaluate Educational Games. In: Lee N. (eds) Encyclopedia of Computer Graphics and Games. Springer.